Some time ago, my wife got back into paint by numbers, where an image is divided into cells and each cell is given a number indicating the colour that area was supposed to be painted. I thought to myself how hard would it be to write a program to convert any image file into something resembling a paint by number canvas? surely not that hard right? Well turns out this wasn’t so easy.
The Problem
There’s a couple problems that need to be addressed in order to get this to work, of which reading an image and extracting pixel data aren’t one of them - these tasks are trivial. I figured the most important issues to solve are the following:
Grouping areas of a given image into like colours.
Splitting up those clusters (subtle foreshadowing) into areas of adjacent pixels.
I tried a few approaches to group like coloured pixels - euclidean distance combined with same pixel value, grouping similar pixels by RGB channel, simple averaging and min/maxing … but nothing seemed to work reliably - if at all. The issue seemed to be the high number of unique pixel values made it difficult to seed these simple approaches and often lead the algorithm astray if an inappropriate seed was selected.
Reducing the number of unique colours seemed to be logical thing to do, therefore as a pre-processing step the source image is converted to grey scale. This conversion reduces the number of colours down to a maximum of 256. In my testing one of my small 250x250 pixel images had several thousand unique colours … so 256 is drastically less, therefore reducing the odds of the code choosing something wrong.

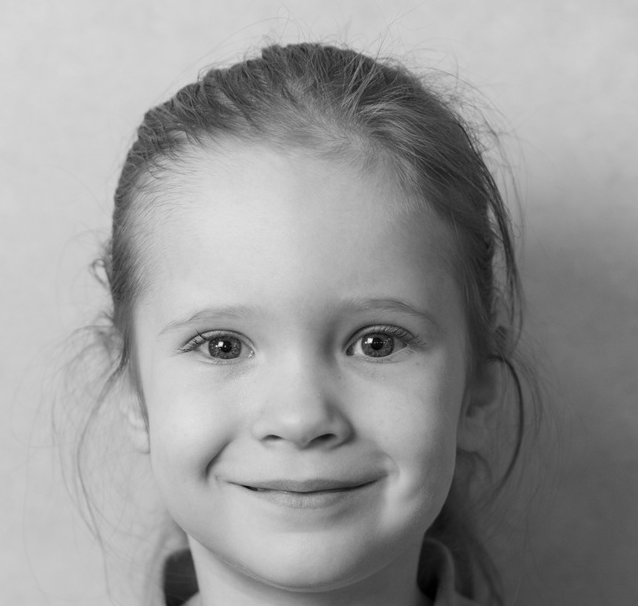
The test subject for this project, my oldest daughter. The gallery component provides a nice way to compare differences between the original image and the grey scale one. The code required to perform the conversion isn’t too special, for a given pixel just average the RGB channels to obtain a value in then range [0,255] and use that value as an index into a table of “grey” values.
Grouping like colours
After fixing that issue I started to wonder if K-Means would be able to solve the problem of grouping like colour pixels, after all forming groups of similar value is what K-Means does! So I decided to give it a go and was very happy with the results, not only does it work; it consistently works without manual seeding, usually converging within 30 iterations. Using the original (non grey scale) image the algorithm either failed to converge or was taking too long.
The following animation shows the clustering algorithm working. The algorithm is initialised with 10 clusters, of which the means are randomly selected pixels from the image. It’s allowed to run until the observation count per cluster has stabilised (i.e. converged). It’s interesting comparing the sections of the image which quickly converge and those that keep changing. I was considering including location of the pixel as another metric to cluster on, but I decided to keep things simple.
Splitting up the clusters
Once the pixels are grouped into like colours, each cluster gets split up into groups of adjacent pixels, this is because we need to know the outline of each group in order to paint the picture. In order to achieve this I developed a recursive nearest neighbour algorithm. I was able to produce the following animation showing the algorithm at work.
Now that we have an outline its just a matter of printing this image to an canvas and painting it. The painting process will require some creative input as there’s no colours or guides (unlike a real paint-by-numbers painting) on the final image. If this software were to be deployed as an actual product then I’d be sure to distribute the original and grey scale image, the painter could use them as a reference for the colours.